Wrangling Real-World Data · 25 min
Auditing a New Dataset
Why audit before you clean
The instinct when you get a new dataset is to start fixing things. Resist it. Cleaning without auditing means you'll fix the problems you notice and miss the ones you don't — and the ones you miss are usually the ones that matter.
A structured audit takes 10 minutes and tells you exactly what you're dealing with before you write a single transformation. It's the difference between a targeted cleaning plan and an hour of df.dropna() followed by a confusing result.
The same applies when you're working with AI-generated wrangling code — which can be syntactically correct while silently mangling your data. The audit protocol you'll learn here is your primary tool for evaluating AI output: it surfaces the problems that slipped through regardless of who wrote the cleaning code.
This lesson gives you a repeatable audit protocol. The dataset you'll use throughout this course is a fictional B2B SaaS company's customer transaction log — transactions.csv — with the kinds of problems you'll encounter constantly in practice.
The dataset
import pandas as pd
import numpy as np

df = pd.read_csv("transactions.csv")
print(df.head())
# row    customer_id   signup_date      plan        monthly_spend   support_tickets   region   churned   last_login_days  notes
# 0      C-0041        2022-01-05       starter     89.00           2.0               APAC     0         14.0             NaN
# 1      C-0042        Jan 6, 2022      pro         210.00          NaN               EMEA     0         3.0              NaN
# 2      c0043         2022-01-07       Starter     74.50           0.0               N/A      1         120.0            "needs follow-up"
# 3      C-0044        2022-01-08       NaN         320.00          5.0               NA       0         NaN              NaN
# 4      C-0045        2022-01-09       pro         95.00           1.0               LATAM    1         45.0             NaN
Already visible: mixed date formats, "Starter" vs "starter" casing, the string "N/A" instead of a real null, a missing plan, and a customer ID that dropped the hyphen (c0043). There's more — the audit will find it.
Step 1: Shape and types
print(df.shape)
# (4820, 9)

print(df.dtypes)
# customer_id         object
# signup_date         object   ← should be datetime
# plan                object
# monthly_spend      float64
# support_tickets    float64   ← int-valued but float dtype
# region              object
# churned              int64
# last_login_days    float64
# notes               object
signup_date is stored as plain text. support_tickets is float despite containing only whole numbers — a sign that NaN forced pandas to upcast from int. Both tell you something about data quality before you've checked a single null.
pandas 3 changes two things this audit relies on. Text columns get their own
strdtype, so on pandas 3df.dtypesshowsstrwhere this lesson showsobject(Google Colab still runs pandas 2). And Copy-on-Write is now the default: chained assignment such asdf["plan"].fillna("unknown", inplace=True)changes a temporary copy, so the nulls indfstay, and the only sign is a warning that's easy to miss. AI tools still write that pandas-2 idiom. When you review a cleaning script, check that every fix is assigned back:df["plan"] = df["plan"].fillna("unknown").
Step 2: Missing values
missing = df.isnull().sum()
missing_pct = (missing / len(df) * 100).round(1)
print(pd.DataFrame({"count": missing, "pct": missing_pct}).sort_values("pct", ascending=False))
#                  count   pct
# notes             4190  86.9
# support_tickets    676  14.0
# plan               437   9.1
# last_login_days    203   4.2
# monthly_spend       18   0.4
# customer_id          0   0.0
# signup_date          0   0.0
# region               0   0.0
# churned              0   0.0
notes is 87% missing — not surprising for a free-text field. support_tickets at 14% is the interesting one: a missing value here likely means zero tickets, not unknown. That distinction matters for how you handle it. plan at 9% needs investigation — customers without a plan may be in a free trial state, which is meaningful.
Step 3: String-encoded nulls
df.isnull().sum() shows zero missing values in region, but look at the raw data: "N/A" appears as a value. pandas treats it as a legitimate string, not a null.
print(df["region"].value_counts(dropna=False))
# APAC      1841
# EMEA      1203
# NA         812
# LATAM      689
# N/A        275
# Name: region, dtype: int64
275 rows contain the string "N/A". Replace them:
df["region"] = df["region"].replace("N/A", np.nan)

print(df["region"].isnull().sum())
# 275
Check every object column for this pattern. Common string nulls: "N/A", "none", "None", "NULL", "-", "".
Step 4: Cardinality and casing
print(df["plan"].value_counts(dropna=False))
# starter      2184
# pro          1398
# enterprise    801
# Starter        98
# Pro            43
# NaN           437
# enterprise     (typo variants, etc.)
"starter" and "Starter" are counted separately. There are 141 customers whose plan is correct but whose records will be treated as a different category by any encoder.
# Check whether normalising case reduces unique values
print(df["plan"].nunique())
# 6
print(df["plan"].str.lower().nunique())
# 3
The right fix — df["plan"] = df["plan"].str.lower().str.strip() — but you can only make it confidently after auditing first.
Do the same for customer_id:
print(df["customer_id"].nunique())
# 4832

print(df["customer_id"].str.upper().nunique())
# 4820
12 customers are duplicated because of casing differences ("C-0043" vs "c0043"). If you count unique customers without this check, your numbers will be wrong.
Step 5: Duplicates
print(df.duplicated().sum())
# 0

print(df.duplicated(subset=["customer_id"]).sum())
# 12
No fully identical rows, but 12 customer IDs appear more than once — likely the same customer recorded under two casing variants. Full-row deduplication would miss this entirely.
Review this code — is it correct?
# Review this code — is it correct?
df["customer_id"] = df["customer_id"].str.upper()
df_clean = df.drop_duplicates()
print(f"Rows after deduplication: {len(df_clean)}")
This code normalises casing first, then deduplicates all columns. It will catch the "C-0043" / "c0043" casing duplicate — but only if both rows are otherwise identical. If the rows differ in any other column (e.g. signup_date formatted differently), drop_duplicates() leaves both in. For logical key deduplication, use drop_duplicates(subset=["customer_id"]) after normalising casing, then decide which of the two rows to keep.
Step 6: Mixed types
Some columns look uniform but aren't:
print(df["signup_date"].apply(type).value_counts())
# <class 'str'>    4820
All strings — that's consistent, but the values are in two formats ("2022-01-05" and "Jan 6, 2022"). You won't see this from dtypes alone; you need to inspect the actual content.
The audit function
Build this once, use it on every new dataset:
def audit(df):
    print(f"Shape: {df.shape}")
    print(f"\nDtypes:\n{df.dtypes}")
    missing = df.isnull().sum()
    missing_pct = (missing / len(df) * 100).round(1)
    print(f"\nMissing:\n{pd.DataFrame({'count': missing, 'pct': missing_pct}).sort_values('pct', ascending=False)}")
    print(f"\nCardinality:\n{df.nunique().sort_values()}")
    print(f"\nFull duplicates: {df.duplicated().sum()}")

audit(df)
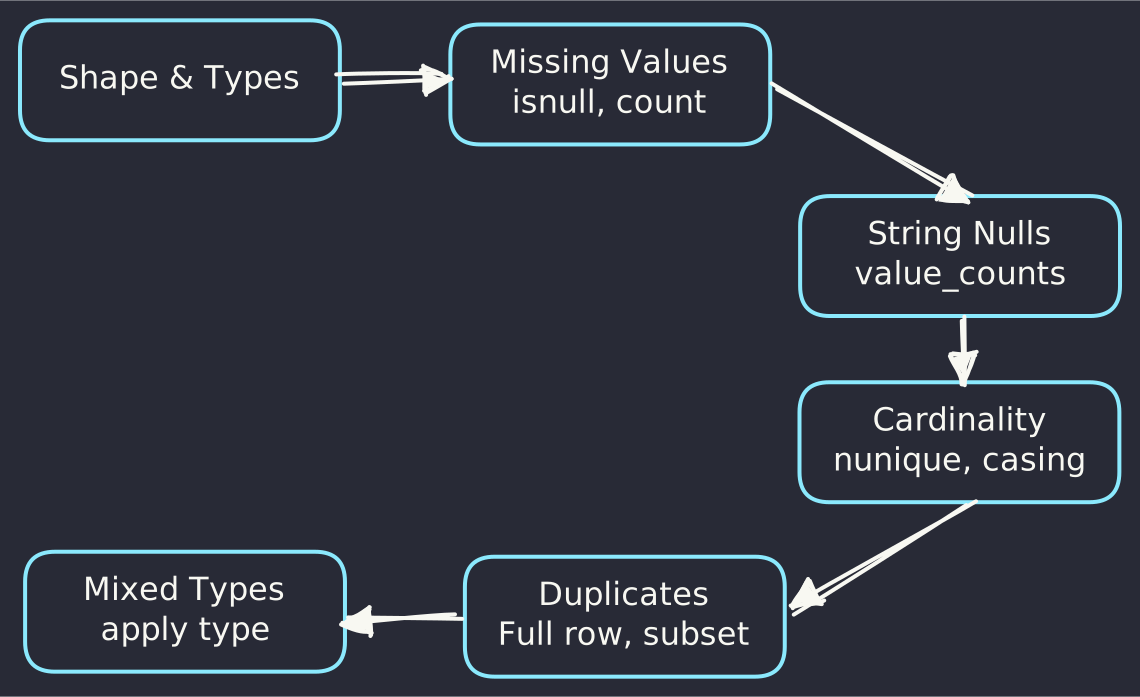
Summary: Audit before you clean. Run shape and dtypes to catch format problems, isnull() to quantify gaps, value_counts(dropna=False) to catch string-encoded nulls, nunique() before and after str.lower() to find casing variants, and duplicated(subset=key) to find logical duplicates that full-row checks miss. Write down what you find before touching the data.
Next lesson: With the audit complete, you know where the missing data is and why. The next lesson covers how to decide what to do about it — because dropna() is rarely the right answer.
Knowledge check
5 questions · pass with 70% or better