Understanding Your Data · 18 min
What is Exploratory Data Analysis?
Before you build anything, look at the data
The most common mistake in data science is reaching for a model before understanding the data. Exploratory Data Analysis (EDA) is the practice of systematically examining a dataset to understand its structure, quality, and content before drawing conclusions or building models.
EDA is not a preliminary step you do quickly so you can get to the "real" work. It is often where the most valuable insights live — and where the most expensive mistakes are caught before they become problems.
What EDA actually involves
EDA has no fixed procedure, but it covers a consistent set of questions:
What shape is the data? How many rows and columns? What are the column names and types? Are there obvious parsing errors (numeric columns read as strings, date columns read as objects)?
What is missing? Which columns have null values, and how many? Is the missingness random, or does it pattern on something — certain time periods, certain customer segments, certain conditions?
What do the distributions look like? Are numeric columns roughly symmetric or heavily skewed? Are there implausible values (negative ages, revenues in the billions when thousands is the scale)? Are categorical columns dominated by a single value?
Are there relationships between columns? Does revenue correlate with tenure? Do certain regions have different churn rates? Do some features move together?
Does anything not make sense? Dates in the future. Customer IDs that appear more than once when they should be unique. Values that contradict each other across rows.
Why EDA changes what you build
EDA is not just defensive hygiene — it actively shapes the analysis. Here are three examples of EDA findings that changed a downstream model:
Discovery: The age column has a spike at exactly 0 and exactly 99. These are not real ages — they are coding errors for unknown values. Impact: Without this finding, a model trained on this column would learn a false relationship between age=0 or age=99 and the target.
Discovery: The target variable (churn) is 94% negative. Impact: A model that predicts "no churn" for every row achieves 94% accuracy. Without seeing this imbalance first, you might mistake a useless model for a good one.
Discovery: order_value and refund_amount are perfectly correlated for 15% of rows. Impact: These rows are fully refunded orders — a distinct segment that may need separate treatment.
None of these would have been visible without EDA. All three would have produced wrong models or wrong conclusions.
What AI changes — and what it doesn't
AI coding assistants can generate profiling scripts, correlation matrices, and distribution plots from a single prompt. The mechanical steps of EDA — the code — can now be delegated.
What they cannot do is tell you whether the output is trustworthy, whether the question being answered is the right one, or what a finding means in your specific context. That gap between output and insight is where the real work happens, and it is entirely human.
Call it the judgment gap: the space between what an AI tool produces and what the analysis actually requires. The goal of this course is not to teach you to write EDA code — it's to give you the judgment to direct AI-assisted EDA effectively and catch problems before they become expensive mistakes.

This matters because AI tools lower the floor for producing output, but they also lower the floor for producing wrong output that looks right. A correlation heatmap generated by an AI is indistinguishable in appearance from a correct one — unless you know what to look for.
The tools you'll use
This course uses Python with pandas, matplotlib, and seaborn. You don't need to memorise every method — the goal is to build the habits and questions, not the syntax. By the end of this course you'll have a repeatable EDA workflow you can run on any new dataset.
import pandas as pd
import matplotlib.pyplot as plt
import seaborn as sns

df = pd.read_csv("data.csv")

# First four things to run on any new dataset
print(df.shape)          # rows × columns
print(df.dtypes)         # column types
print(df.head())         # first five rows
print(df.isna().sum())   # missing value counts
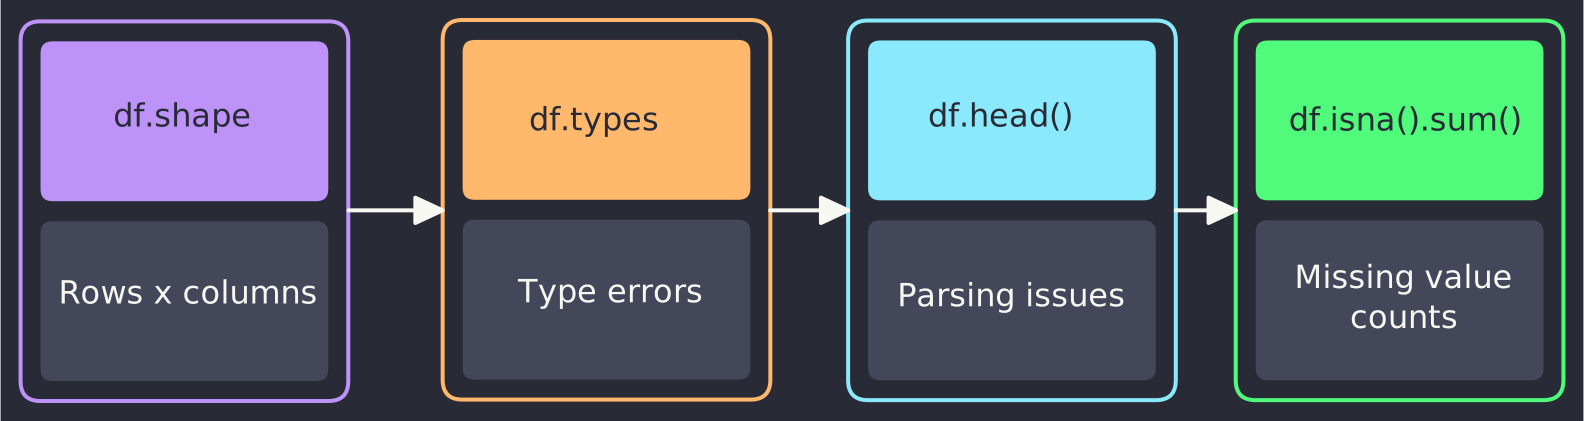
These four lines take five seconds and will tell you more about a dataset than you'd get from reading its documentation.
What this course covers
This course builds a complete EDA workflow across two modules:
Module 1 — Understanding Your Data
- This lesson: what EDA is and why it matters
- Profiling a new dataset: shape, types, missingness
- Distributions: how to read what the data is telling you
- Outliers: finding them, understanding them, and deciding what to do
Module 2 — Patterns and Relationships
- Relationships between variables: correlation and its limits
- Grouping and segmentation: finding patterns across categories
- Directing a full AI-assisted EDA: prompting, reviewing, and producing a defensible analysis
Summary: EDA is the systematic examination of a dataset before modelling or analysis. It answers questions about shape, missingness, distributions, and relationships — and consistently surfaces findings that change what gets built. The four lines shape, dtypes, head(), and isna().sum() are the starting point for any new dataset.
Next: Profiling a new dataset — a systematic approach to learning what you're working with.
Knowledge check
3 questions · pass with 70% or better