Foundations · 25 min
What Is Unsupervised Learning?
The unlabelled world
You've built supervised models. You have data, you have labels, you train a classifier or regressor. But in the real world, labels are expensive. Sometimes you don't even know what labels would be useful.
Imagine you run an e-commerce platform. You have millions of customer transactions. You want to tailor product recommendations, but you don't have a label that says "is a good customer for product X." You have only behaviour — what they bought, how long they spent, what they returned. Can you find natural segments in your user base without asking anyone to label them first?
That's unsupervised learning. It's finding structure, patterns, or groups in data when no target variable exists. And it's often more valuable than supervised models because it can answer questions you didn't know to ask.
Three families of unsupervised learning
Unsupervised problems fall into three broad categories.
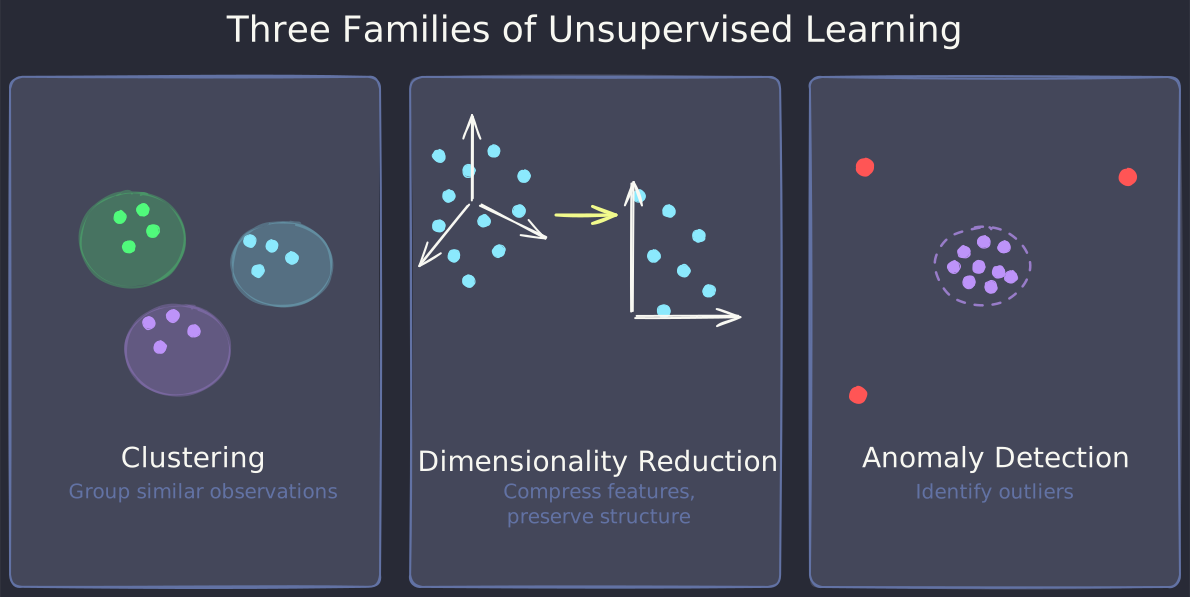
Clustering
Find groups of similar observations. Examples:
- Customer segmentation for targeting
- Gene expression grouping in biology
- Document clustering for topic discovery
- Anomaly detection (treat outliers as their own cluster)
Clustering assumes observations can be meaningfully grouped by similarity — but similarity is contextual. Euclidean distance? Correlation? Graph-based connectivity? Different metrics reveal different groupings. Choosing the right distance and algorithm is where judgment lives.
Dimensionality reduction
Reduce the number of features while preserving important information. Examples:
- Compress high-dimensional data (images, gene expression) before clustering
- Visualise high-dimensional data in 2D
- Remove noise without losing signal
- Speed up downstream models
The catch: "important information" depends on your downstream task. PCA preserves variance but not discrimination. t-SNE and UMAP are great for visualisation but don't generalise to new data. Choosing the reduction method is a business decision, not a pure statistical one.
Anomaly detection
Identify outliers or anomalous observations. Examples:
- Credit card fraud detection
- Manufacturing defect detection
- Network intrusion detection
Anomaly detection is often phrased as "find observations that don't fit the normal pattern." But what counts as "normal"? If your training data is contaminated with anomalies, your definition of normal is biased. Lesson 11 covers three concrete approaches — DBSCAN noise points, Isolation Forest, and PCA reconstruction error — and the judgment calls that separate useful detection from noisy false-positive lists.
What you'll learn in this course
| Lesson | Method | Primary use |
|---|---|---|
| 2 — Distance and similarity | Foundation | Choosing the right metric for your data |
| 3 — K-means clustering | Partitional | Fast, scalable; assumes spherical clusters |
| 4 — Choosing k | Evaluation | Elbow method, silhouette, and knowing when both fail |
| 5 — DBSCAN | Density-based | Arbitrary shapes; sensitive to density and scaling |
| 6 — Hierarchical clustering | Linkage-based | Explore cluster structure at all resolutions |
| 7 — Dimensionality reduction with PCA | Linear | Variance preservation; statistical foundation |
| 8 — t-SNE and UMAP | Nonlinear | Visualisation; understand their limits |
| 9 — Evaluating clustering | Metrics | When you have no ground truth, how do you measure quality? |
| 10 — Clustering in production | Workflow | Serialising, monitoring, retraining |
| 11 — Anomaly detection | Application | DBSCAN noise, Isolation Forest, PCA reconstruction error |
Each lesson solves a real failure mode: mismatched distance metrics, choosing k, over-interpreting visualisations, missing the stability problem, deploying a pipeline that drifts silently.
Summary
Unsupervised learning answers questions when labels don't exist. Clustering groups observations by similarity; dimensionality reduction compresses while preserving structure; anomaly detection identifies outliers. Each method makes assumptions about what similarity or structure means — your job is to make those assumptions explicit and choose the method that's right for the problem.
Next: Lesson 2 covers distance and similarity metrics — the foundation for all clustering methods.
Knowledge check
6 questions · pass with 70% or better